
BPUT SAMPLE PAPER FOR CONTROL SYSTEM ENGINEERING
Last Updated: Mar 15, 2013
CONTROL SYSTEM ENGINEERING
FULL MARKS:-70
Q .1 is compulsory and comprises 20 marks (each bit contain 2 marks)
Q2. – Q7 (do any five) contains 10 marks each ( each bit contain 10 marks)
1.
(a) What do you understand about two control objectives such as Regulation and Servomechanism?
Ans:-
(i) Servo mechanism:- It is the power amplifying close loop feedback control. Main objective is to control the position of the mechanical load in accordance with reference position.
(ii) Regulator:- It is the closed loop feedback control. Main objective is to maintain desired steady state output despite change in input.
(b) Define a causal system with both a statement and an equation?
Ans:-The response of the causal system to an input does not depend or future values of input but depends only the present and/ or past values of the input.
Y(n) = x(n)
Y(n) =x(n) – 0.5 x(n-1)
(c) Why do you need a feedback controller? Illustrate your answer with an example.
Ans:- We need a feedback controller because of its:-
(i) Gain and stability
(ii) B.w. increases
(iii) Time constant less
(iv) Response faster
Eg:- T(s) = 4(s) / [1+ G(s) H(s)]
(d) Why it is necessary that the poles of a system should be in the left half S-plane for a system to be stable? What is about the stability of LTI system in terms of eigen values?
Ans:- The function should be real and +ve and all the eigen values have –ve real part. Then the system is stable.
(e) Which type of AC motor is used n servo applications and why?
Ans:- 2-phase induction motor is used in servo application because two windings are apart from each other by 90 degree.
(f) What is the transfer function of a ZOH device?
Ans:- Transfer function of ZOH device = [ 1- e^(-st) ] / s
(g) What is the PID control law in continuous time system? Is there any heuristic rule to obtain a PID control gain?
Ans:- The PID control law in continuous time system is:-
For setting Kp = finite, Td = 0, Ti = infinite
Kp = finite, Td = 0, Ti = finite
Kp = finite, Td = finite, Ti = finite
Yes, there is a heuristic rule to obtain PID control gain again
(h) Explain gain margin and phase margin
Ans:- Gain margin:-It is the amount of gain in decibels that can be added to loop before the closed system becomes unstable.
Phase margin :- it is the amount of phase shift in degrees that can be added to the loop before the closed loop system becomes unstable.
(i) Explain the effects of adding a zero to a second order system?
Ans:- The effect of adding zero to a second order system are:-
(i) System stability increases
(ii) Magnitude of peak overshoot increases.
(iii) In a sluggish system adding a zero at the proper position can improve the transient response.
(j) What are the effects of integral control action?
Ans:- The effects of integral control action are:-
(i) It improves the steady state state response.
(ii) Improvement of damping and reduction of overshoot.
(iii) Bandwidth increases.
(iv) Noise filtered out.
2. Explain Zeigler – Nichols method of Tuning PID controllers.
Ans:- Ziegler and Nicholas proposed methods for determining values of the proportional gain Kp, integral time Ti and derivative time Td based on transient response characteristics of a given plant.
(a) Reaction curve method :-
In this method, we obtain experimentally the response of the plant to a unit step input.
This method applies if the response to a step input exhibits an s-shaped curve. Such a step- response curves may be generated experimentally or from dynamic simulation of the plant.
The s-shaped curve may be characterised by two constants, delay time ‘L’ and time constant ‘T’. The delay time and time constant are determined by drawing a tangent line at the inflection point of the s-shaped curve and determining the intersections of the tangent line with the time axis and c(t) = K
The value of Kp, Ti and Td for step response plant is given below :-
(i) For P type of controller, Kp = T/L, Ti = infinite, Td=0
(ii) For PI type of controller, Kp=0.9 T/L, Ti = L/0.3, Td=0a
(iii) For PID type of controller, Kp= 1.2 T/L, Ti=2L, Td= 0.5L
(b) Continuous cycling method :-
In this method the closed loop system is tested using proportional control action only to determine the values of controller settings. For a P-I-D controller, the integral action time Ti is set to its highest value (infinity) and the derivative action time Td set to its lowest value(zero). So, only the proportional mode is effective. Starting with low values of the proportional gain Kp, the gain is increased until continuous cycling at a constant amplitude occurs in the plant output.
The value of kp , Ti and Td is given below based on critical gain:-
(i) For P type, Kp = 0.5 Kcr, Ti = infinite, Td = 0
(ii) For PI type, Kp = 0.45 Kcr, Ti= 1/0.2 Pcr, Td=0
(iii) For PID type, Kp = 0.6 Kcr, Ti= 0.5 Pcr, Td= 0.125 Pcr
3. Explain the effects of the different controller gains of PID controller on the system’s performance from the basic equations of the PID controller.
Ans:- Proportional controller:-
In P controller the actuating signal for the control action in a control system is proportion to the error signal.
Ea (s) = Kp E(s) – ϵ α [1/ (√Kp t) ]
Effect of proportional controller:-
(i) The increase in forward path reduces the steady state error.
(ii) Maximum overshoot increases due to increase in forward path.
(iii)”ωn” increases due to increase in “Kp”.
Derivative control :-
For the derivative control action the activating signal consists of proportional error signal added with the derivative of the error signal
Activating signal Ea(s) = Es + S Kd E(s)
(i) Steady state error is not affected by derivative control action.
(ii) Rise time Tr reduces due to use of derivative control action.
(iii) Damping factor of the system increases. Hence maximum overshoot reduces.
(iv) Response become slower.
Integral action
For integral action the activating signal if proportional error signal signal added with (n) if the error signal will be:-
E(s) = (s) + [K^2 E(s)] / S
Effect of integral controller:-
(i) Due to integral controller type of the system increases.
(ii) Due to integral controller stedy. State error of the system increases.
4. Explain the constant M-circles and the constant N-circles.
Ans:- M-circles :- These are the constant gain circles for unity feedback systems and convenient in determining the closed loop frequency of the system
G(jω) = x + jy
C(iω) / R(iω) = G(iω) / 1+G(jω) =[x+jy] / 1+x+jy = M.e^(jα)
The above equation is the equation of a circle whose centre is X0 = M^2 / (1-M^2) ,Y0 = 0 and radius in r0 = [M / 1-(M^2)]
N circles:- α = {x +jy} / {1+x+jy}
= tan^-1 (y/x) – tan^-1(y/1+x)
= tan α
= tan {tan^-1(y/1+x) – tan^-1(y/1+x) }
The above eqn is a equation of circle with centre.
X0 = -1/2 , Y0 =1/2N and radius r0 = 1/ 2n (N^2 +1)^(1/2 )
The value of N is constant. These circles are N-circles.
Using M and N circles the closed loop frequency response for a given open loop response can be determined. The magnitude and phase angle can be obtained without calculation.
5.What is Nichol’s chart? Explain.
Ans:- Nichols’s chart gives us the transformation of M and its constant- N circles to log magnitude and phase angle coordinates and the resulting chart is known as Nichol’s chart. Log-magnitude phase plot of the given open loop transfer function drawn on Nichol’s chart gives both the gain and phase of the closed loop system.
Given below is diagram of Nichol’s chart:-
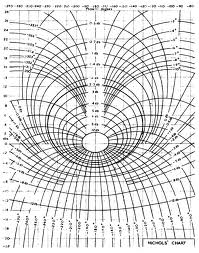
The 20 log [G(jω)] versus phase curve is drawn on Nichol’s chart to find out closed loop frequency response. We can directly read the magnitude and phase angls at the intersection points of log- magnitude-phase curve and M, N circles.
The largest magnitude contour touched by the 20 log [G(jω)] versus phase plot locus gives the resonant peak and frequency at the touching point is the resonant frequency at this resonant peak.
The phase crossover frequency is the point where locus cut and the -180 degree line.
The gain crossover frequency is the point where the locus cuts the 0 dB line.
The phase margin is the horizontal distance between the gain cross over point and the (0dB, -180 degree) point.
The band width of the closed loop system is the frequency at which the 20 log [G(jω)] locus intersects -3dB line.
Th advantage of this method is the shape of the 20 log [G(jw)] curve remains unchanged as gain K varies but it shifts up and down by increasing and decreasing the gain K. For smaller value of K, the locus may not touch the M-Loci indicates that there is no resonance in the closed loop response.
6. What are the time response specifications?
Ans:- The practical control systems exhibits damped oscillations before reaching steady state. In specifying the transient response, the transient response, the specifications are
(i) Delay time (td) :- It is the time required for the response or output to reach from 0 to 50% of the steady state value at the first instant.
(ii) Rise time ( tr) :- For an under damped system, this is defined as the time taken for the response to go from 0 to 1005 of the steady state value at the first instant.
For critically and over damped systems it is the time taken for the response to go from 10% to 90% of the steady state value.
(iii) Peak time (tp):- It is the time required for the response to reach the first peak overshoot.
(iv) Peak overshoot or maximum overshoot (Mp):- It is the maximum deviation of the instantaneous output above the steady state value.
This is normally expressed in percentage (%)
(%) Peak over shoot = { [C(tp) –C(infinite) ] / C(infinite) } × 100 %
The amount of maximum overshoot indicates the relative stability of the syste.
(v) Settling time(ts) :- It is the time required for the response to reach and stay within specified percentage (%) of steady state value. (usually 2% or 5%)
(vi) Steady state error (ess):- It is defined as the error between the actual output and desired output as ‘t’ tends infinity.
7. Explain about standard test signals.
Ans:- The different standard test signals are:-
(i) Step signal:- It is a signal whose magnitude changes from zero to another level a in negligible time (no time). It is generally represented mathematically as;
R(t) = Au(t)
Where, u(t) =1; t > 0
=0; t < 0
(ii) Ramp signal(constant velocity signal) :- It is a signal starts at a value of zero and increases linearly with time.
It is generally represented mathematically as
R(t) = Bt, t > 0
=0, t < 0
(iii) Parabolic signal(acceleration signal):- It is a signal which looks like a parabola and starts from zero.
It is generally representsd mathematically as
R(t) = C[t^2 / 2]; t > 0
= 0; t < 0
(iv) Impulse signal:- It is a signal exists at time (t=0) only. An unit impulse mathematically represented as Δ(t) =1; t = 0
=0; t ‡ 0
Discover more from Our Education | Best Coaching Institutes Colleges Rank
Subscribe to get the latest posts sent to your email.
Tell us Your Queries, Suggestions and Feedback
« ICSE Schools in Gujarat MULTI TOUCH TECHNOLOGY: AMAZING INVENTIONS »
2 Responses to BPUT SAMPLE PAPER FOR CONTROL SYSTEM ENGINEERING